We use cookies to enhance the usability of our website. If you continue, we'll assume that you are happy to receive all cookies. More information. Don't show this again.
On the top, protein expression in current human tissue, based on all annotated cell types, is reported with the units not detected (n), low (l), medium (m) and high (h). Underneath, protein expression in each annotated cell type are reported using the same units.
Protein expression data is based on knowledge-based annotation. For genes where more than one antibody has been used, a collective score is set.
If knowledge-based annotation could not be performed for a gene, no data is displayed here. View antibody staining data further down this page.
h
m
l
n
Basal cells:
High
Ciliated cells (cell body):
High
Ciliated cells (cilia axoneme):
High
Ciliated cells (ciliary rootlets):
Not detected
Ciliated cells (tip of cilia):
High
Goblet cells:
High
Protein profiling Multiplex tissuei
A summary of the protein localization in the current human tissue based on multiplex immunohistochemistry profiling in selected tissues is shown for genes where this analysis has been performed.
Staining in cilia axoneme in ciliated cells. Additional staining in nucleus in ciliated cells.
RNA expressioni
A summary of mRNA expression data available for current tissue based on several datasets. The mRNA expression levels in human tissues are based on RNA-seq data generated by the Human Protein Atlas (HPA), Genotype-Tissue Expression (GTEx) portal and CAGE data generated by the FANTOM5 consortium. Consensus normalized expression levels for human tissues was created by combining the data from HPA and GTEx datasets.
The mRNA expression levels in pig are based on RNA-seq data generated by the Human Protein Atlas (HPA), and for mouse, HPA data and in situ hybridization generated by the Allen brain atlas are reported.
Scroll down to view mRNA expression data in more detail.
No data
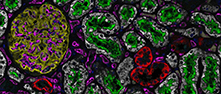
CILIATED CELLS 2 - Multiplex stainingi
Antibody localization in the annotated cell types/states/structures of the current human tissue is reported as main/additional locations, percent overlap between the antibody and cell type/state/structure-specific markers, and, when applicable also subcellular localization. The scores are based on multiplex immunohistochemistry profiling in selected tissues.
Main locations are characterized by a high overlap between the antibody and the cell type/state-specific marker combined with strong antibody signal intensity,
while additional locations are characterized by lower overlap and weaker antibody signal intensity.
The antibody of interest is reported in green, while cell types/states/structures are reported in various other colors, and DAPI (marks nucleus) is reported in blue. Colors can be toggled on and off by clicking on the name of the cell type/state of interest, “Antibody” or “DAPI”. To toggle between the different tissue samples, click on the miniature images at the right bottom corner of the main image. The miniature images appear upon hovering the mouse over that area.
- Antibody HPA036324
Main location
Cilia axoneme
Additional location
Nucleus
No antibody overlap
Antibody overlap
>75%
Location
No antibody overlap
No antibody overlap
Antibody overlap
<25%
Location
NASOPHARYNX - Antibody stainingi
Antibody staining in the annotated cell types in the current human tissue is reported as not detected, low, medium, or high, based on conventional immunohistochemistry profiling in selected tissues. This score is based on the combination of the staining intensity and fraction of stained cells.
Each image is clickable and will lead to virtual microscopy that enables deeper exploration of all samples and also displays staining intensity scores, fraction scores and subcellular localization as well as patient and tissue information for each sample.

 The Human Protein Atlas project is funded