We use cookies to enhance the usability of our website. If you continue, we'll assume that you are happy to receive all cookies. More information. Don't show this again.
SLAMF8
HPA
RESOURCES
  • TISSUE
  • BRAIN
  • SINGLE CELL
  • SUBCELLULAR
  • CANCER
  • BLOOD
  • CELL LINE
  • STRUCTURE & INTERACTION
ABOUT
  • INTRODUCTION
  • HISTORY
  • ORGANIZATION
  • PUBLICATIONS
  • ANTIBODY SUBMISSION
  • ANTIBODY AVAILABILITY
  • ACKNOWLEDGMENTS
  • CONTACT
NEWS
  • NEWS ARTICLES
  • PRESS ROOM
LEARN
  • DICTIONARY
  • PROTEIN CLASSES
  • PROTEIN EVIDENCE
  • METHODS
  • EDUCATIONAL VIDEOS
DATA
  • DOWNLOADABLE DATA
  • PUBLICATION DATA
  • RELEASE HISTORY
HELP
  • ANTIBODY VALIDATION
  • ASSAYS & ANNOTATION
  • DISCLAIMER
  • HELP & FAQ
  • PRIVACY STATEMENT
  • LICENCE & CITATION
Fields ยป
Search result

 
Field
All
Term
Gene name
Class
Blood group antigen proteins
Subclass
 
Class
 
Keyword
Chromosome
External id
Tissue
 
Cell type
 
Expression
Antibody panel
 
Tissue
 
Main location
Patient ID
Annotation
Tissue
Category
Tau score
Cluster
Reliability
Brain region
Category
Tau score
Brain region
Category
Tau score
Brain region
Category
Tau score
Cluster
Reliability
Tissue
 
Cell type
Enrichment
Cell type
Category
Tau score
Cell type
Category
Tau score
Cell type
Category
Tau score
Cell lineage
Category
Tau score
Cluster
Cluster
Location
Searches
Location
Cell line
Class
Type
Phase
Reliability
Cancer
Prognosis
Cancer
Category
Cancer
Category
Tau score
Cluster
Variants
Interacting gene (ensg_id)
Type
Number of interactions
Pathway
Category
Score
Score
Score
Validation
Validation
Validation
Validation
Antibodies
Yes
Data type
Column
Gene


                              • SPECIFICITY
                              • DISTRIBUTION
                              • EXPRESSION
                              • SPECIFICITY
                              • DISTRIBUTION
                              • EXPRESSION
                              • SPECIFICITY
                              • DISTRIBUTION
                              • EXPRESSION
                              • SPECIFICITY
                              • DISTRIBUTION
                              • EXPRESSION
                                • SPECIFICITY
                                • DISTRIBUTION
                                • EXPRESSION
                                • SPECIFICITY
                                • DISTRIBUTION
                                • EXPRESSION
                                • SPECIFICITY
                                • DISTRIBUTION
                                • EXPRESSION
                                • SPECIFICITY
                                • DISTRIBUTION
                                • EXPRESSION
                                • RELIABILITY
                                • SUBCELLULAR VARIATION
                                • MULTILOCALIZATION
                                • OTHER
                                • SPECIFICITY
                                • DISTRIBUTION
                                • EXPRESSION
                                • SPECIFICITY
                                • DISTRIBUTION
                                • EXPRESSION
                                • Check all
                                • Uncheck all
                                        • SUMMARY

                                        • TISSUE

                                        • BRAIN

                                        • SINGLE CELL

                                        • SUBCELL

                                        • CANCER

                                        • BLOOD

                                        • CELL LINE

                                        • STRUCT & INT

                                        • SLAMF8
                                        TISSUE PRIMARY DATA TISSUES Show tissue menu
                                        ADIPOSE TISSUE ADRENAL GLAND AMYGDALA APPENDIX BASAL GANGLIA BONE MARROW BREAST BRONCHUS CEREBELLUM CEREBRAL CORTEX CERVIX CHOROID PLEXUS COLON DUODENUM
                                        ENDOMETRIUM EPIDIDYMIS ESOPHAGUS FALLOPIAN TUBE GALLBLADDER HEART MUSCLE HIPPOCAMPAL FORMATION HYPOTHALAMUS KIDNEY LIVER LUNG LYMPH NODE MIDBRAIN NASOPHARYNX
                                        ORAL MUCOSA OVARY PANCREAS PARATHYROID GLAND PITUITARY GLAND PLACENTA PROSTATE RECTUM RETINA SALIVARY GLAND SEMINAL VESICLE SKELETAL MUSCLE SKIN SMALL INTESTINE
                                        SMOOTH MUSCLE SOFT TISSUE SPINAL CORD SPLEEN STOMACH TESTIS THYMUS THYROID GLAND TONGUE TONSIL URINARY BLADDER VAGINA
                                        ANTIBODIES
                                        AND
                                        VALIDATION
                                        Dictionary
                                        Tissue proteome
                                        GENERAL INFORMATIONi

                                        General description of the gene and the encoded protein(s) using information from HGNC and Ensembl, as well as predictions made by the Human Protein Atlas project.

                                        Gene namei

                                        Official gene symbol, which is typically a short form of the gene name, according to HGNC.

                                        SLAMF8
                                        Gene descriptioni

                                        Full gene name according to HGNC.

                                        SLAM family member 8
                                        Protein classi

                                        Assigned HPA protein class(es) for the encoded protein(s).

                                        CD markers
                                        Predicted locationi

                                        All transcripts of all genes have been analyzed regarding the location(s) of corresponding protein based on prediction methods for signal peptides and transmembrane regions.

                                        • Genes with at least one transcript predicted to encode a secreted protein, according to prediction methods or to UniProt location data, have been further annotated and classified with the aim to determine if the corresponding protein(s) are secreted or actually retained in intracellular locations or membrane-attached.

                                        • Remaining genes, with no transcript predicted to encode a secreted protein, will be assigned the prediction-based location(s).

                                        The annotated location overrules the predicted location, so that a gene encoding a predicted secreted protein that has been annotated as intracellular will have intracellular as the final location.

                                        Membrane
                                        Number of transcriptsi

                                        Number of protein-coding transcripts from the gene as defined by Ensembl.

                                        2
                                        HUMAN PROTEIN ATLAS INFORMATIONi

                                        Summary of RNA expression analysis and annotation data generated within the Human Protein Atlas project.

                                        Tissue expression
                                        cluster (RNA)i

                                        The RNA data was used to cluster genes according to their expression across tissues. Clusters contain genes that have similar expression patterns, and each cluster has been manually annotated to describe common features in terms of function and specificity.

                                        Lymphoid tissue - Immune response (mainly)
                                        Tissue specificity (RNA)i

                                        The RNA specificity category is based on mRNA expression levels in the consensus dataset which is calculated from the RNA expression levels in samples from HPA and GTEX. The categories include: tissue enriched, group enriched, tissue enhanced, low tissue specificity and not detected.

                                        Tissue enhanced (Lymphoid tissue)
                                        Tau specificity score (RNA)i

                                        Tau specificity score is a numerical indicator of the specificity of the gene expression across cells or tissues. The value ranges from 0 and 1, where 0 indicates identical expression across all cells/tissue types, while 1 indicates expression in a single cell/tissue type.

                                        0.60
                                        Tissue distribution (RNA)i

                                        The RNA distribution category is based on mRNA expression levels in the analyzed samples based on a combination of data from HPA and GTEX. The categories include: detected in all, detected in many, detected in some, detected in single and not detected.

                                        Detected in many
                                        Protein evidencei

                                        Evidence score for genes based on UniProt protein existence (UniProt evidence); neXtProt protein existence (neXtProt evidence);and a Human Protein Atlas antibody- or RNA based score (HPA evidence). The avaliable scores are evidence at protein level, evidence at transcript level, no evidence, or not avaliable.

                                        Evidence at protein level
                                        Protein expressioni

                                        A summary of the overall protein expression pattern across the analyzed normal tissues. The summary is based on knowledge-based annotation.

                                        "Estimation of protein expression could not be performed. View primary data." is shown for genes analyzed with a knowledge-based approach where available RNA-seq and gene/protein characterization data has been evaluated as not sufficient in combination with immunohistochemistry data to yield a reliable estimation of the protein expression profile.
                                        Cytoplasmic expression in immune cells.

                                        IMMUNOHISTOCHEMISTRY DATA RELIABILITY
                                        Data reliability
                                        descriptioni

                                        Standardized explanatory sentences with additional information required for full understanding of the protein expression profile, based on knowledge-based and secretome-based annotation.

                                        High consistency between antibody staining and RNA expression data.
                                        Reliability scorei

                                        A reliability score is manually set for all genes and indicates the level of reliability of the analyzed protein expression pattern based on available RNA-seq data, protein/gene characterization data and immunohistochemical data from one or several antibodies with non-overlapping epitopes. The reliability score is based on the 44 normal tissues analyzed, and if there is available data from more than one antibody, the staining patterns of all antibodies are taken into consideration during evaluation.

                                        The reliability score is divided into Enhanced, Supported, Approved, or Uncertain, and is displayed on both Tissue resource and Cancer resource.

                                        Enhanced
                                        Antibodiesi

                                        Antibodies used for this assay. Click on an antibody for more information.

                                        HPA067601
                                        SHOW MORE
                                        ASSAYSi

                                        Links to data of the different assays available in the Tissue resource of the Human Protein Atlas. Click on the miniature images to directly get to the respective section.

                                        Protein expression Expression clustering
                                        Cerebral cortexCerebellumBasal gangliaHypothalamusMidbrainAmygdalaChoroid plexusHippocampal formationSpinal cordRetinaThyroid glandParathyroid glandAdrenal glandPituitary glandLungSalivary glandEsophagusTongueStomachDuodenumSmall intestineColonRectumLiverGallbladderPancreasKidneyUrinary bladderTestisEpididymisSeminal vesicleProstateVaginaOvaryFallopian tubeEndometriumCervixPlacentaBreastHeart muscleSmooth muscleSkeletal muscleAdipose tissueSkinAppendixSpleenLymph nodeTonsilBone marrowThymus05101520253035
                                        RNA expression
                                        RNA AND PROTEIN EXPRESSION SUMMARYi

                                        Below is an overview of RNA and protein expression data generated in the Human Protein Atlas project. Analyzed tissues are divided into color-coded groups according to which functional features they have in common. For each group, a list of included tissues is accessed by clicking on the group name, group symbol, RNA bar, or protein bar. Subsequent selection of a particular tissue in this list links to the image data page.

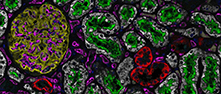
                                        The IHC image panel to the right display selected tissues that give a visual summary of the protein expression profile.

                                        To the left, the two human bodies provide an anatomical display of the expression levels and detection of mRNA in the analyzed organs. Toggle between these two views by clicking on the buttons between the figures.

                                        Expression
                                        Detection
                                        All organs
                                        RNA expression (nTPM)i

                                        RNA expression summary shows the consensus data based on normalized expression (nTPM) values from two different sources: internally generated Human Protein Atlas (HPA) RNA-seq data and RNA-seq data from the Genotype-Tissue Expression (GTEx) project. Color-coding is based on tissue groups, each consisting of tissues with functional features in common. To access sample data, click on tissue name or bar.

                                        Protein expression (score)i

                                        Each bar represents the highest expression score found in a particular group of tissues. Protein expression scores are based on a best estimate of the "true" protein expression from a knowledge-based annotation, described more in detail under Assays & annotation. For genes where more than one antibody has been used, a collective score is set displaying the estimated true protein expression.

                                        Brain
                                        Hippocampal formation
                                        Amygdala
                                        N/A
                                        Basal ganglia
                                        Midbrain
                                        N/A
                                        Spinal cord
                                        N/A
                                        Cerebral cortex
                                        Cerebellum
                                        Hypothalamus
                                        N/A
                                        Choroid plexus
                                        N/A
                                        Eye
                                        Retina
                                        N/A
                                        Endocrine tissues
                                        Thyroid gland
                                        Parathyroid gland
                                        Adrenal gland
                                        Pituitary gland
                                        N/A
                                        Respiratory system
                                        Nasopharynx
                                        N/A
                                        Bronchus
                                        N/A
                                        Lung
                                        Proximal digestive tract
                                        Oral mucosa
                                        N/A
                                        Salivary gland
                                        Esophagus
                                        Tongue
                                        N/A
                                        Gastrointestinal tract
                                        Stomach
                                        Small intestine
                                        Colon
                                        Rectum
                                        Duodenum
                                        Liver & Gallbladder
                                        Liver
                                        Gallbladder
                                        Pancreas
                                        Pancreas
                                        Kidney & Urinary bladder
                                        Kidney
                                        Urinary bladder
                                        Male tissues
                                        Testis
                                        Epididymis
                                        Prostate
                                        Seminal vesicle
                                        Female tissues
                                        Vagina
                                        Breast
                                        Cervix
                                        Endometrium
                                        Fallopian tube
                                        Ovary
                                        Placenta
                                        Muscle tissues
                                        Heart muscle
                                        Skeletal muscle
                                        Smooth muscle
                                        Connective & Soft tissue
                                        Soft tissue
                                        N/A
                                        Adipose tissue
                                        Skin
                                        Skin
                                        Bone marrow & Lymphoid tissues
                                        Bone marrow
                                        Appendix
                                        Thymus
                                        N/A
                                        Spleen
                                        Lymph node
                                        Tonsil
                                        Cerebral cortex

                                        Colon

                                        Liver

                                        Kidney

                                        Testis

                                        Lymph node

                                        Spleen

                                        PROTEIN EXPRESSION OVERVIEWi

                                        Protein expression data is shown for each of the 44 tissues based on knowledge-based annotation. Color-coding is based on tissue groups, each consisting of tissues with functional features in common. Mouse-over function shows protein score for analyzed cell types in a selected tissue. To access image data click on tissue name or bar. Annotation of protein expression is described in detail in Assays & annotation.

                                        For genes with available protein data for which a knowledge-based annotation gave inconclusive results, no protein expression data is displayed in the protein expression data overview. However, all immunohistochemical images are still available and the annotation data can be found under Primary data.
                                        Organ
                                        Expression
                                        Alphabetical
                                        Cerebral cortexCerebellumHippocampusCaudateThyroid glandParathyroid glandAdrenal glandNasopharynxBronchusLungOral mucosaSalivary glandEsophagusStomachDuodenumSmall intestineColonRectumLiverGallbladderPancreasKidneyUrinary bladderTestisEpididymisSeminal vesicleProstateVaginaOvaryFallopian tubeEndometriumCervixPlacentaBreastHeart muscleSmooth muscleSkeletal muscleSoft tissueAdipose tissueSkinAppendixSpleenLymph nodeTonsilBone marrowNotdetectedLowMediumHighScore
                                        EXPRESSION CLUSTERING & CORRELATIONi

                                        The RNA data was used to cluster genes according to their expression across samples. The resulting clusters have been manually annotated to describe common features in terms of function and specificity. The annotation of the cluster is displayed together with a confidence score of the gene's assignment to the cluster. The confidence is calculated as the fraction of times the gene was assigned to this cluster in repeated calculations and is reported between 0 to 1, where 1 is the highest possible confidence. The clustering results are shown in a UMAP, where the cluster this gene was assigned to is highlighted as a colored area in which most of the cluster genes reside. A table shows the 15 most similar genes in terms of expression profile.

                                        SLAMF8 is part of cluster 70 Lymphoid tissue - Immune response with confidencei

                                        Confidence is the fraction of times a gene was assigned to the cluster in repeated clustering, and therefore reflects how strongly associated it is to the cluster. A confidence of 1 indicates that the gene was assigned to this cluster in all repeated clusterings.

                                        0.75
                                        420 genes in cluster
                                        Go to interactive expression cluster page
                                        15 nearest neighbours based on tissue RNA expression
                                        Neighbouri

                                        Gene name according to HGNC.

                                        Descriptioni

                                        Gene description according to HGNC.

                                        Correlationi

                                        Correlation between the selected gene and neighboring gene. Correlation is calculated as Spearman correlation in PCA space based on the RNA-seq expression data.

                                        Clusteri

                                        ID of the expression cluster of the neighboring gene.

                                        AIM2 Absent in melanoma 2 0.9456 36
                                        MMP12 Matrix metallopeptidase 12 0.9158 70
                                        POU2F2 POU class 2 homeobox 2 0.9070 70
                                        CD80 CD80 molecule 0.9000 36
                                        POU2AF1 POU class 2 homeobox associating factor 1 0.8982 70
                                        CCR2 C-C motif chemokine receptor 2 0.8930 70
                                        MIXL1 Mix paired-like homeobox 0.8912 70
                                        GAPT GRB2 binding adaptor protein, transmembrane 0.8877 36
                                        CCR5 C-C motif chemokine receptor 5 0.8860 70
                                        IL2RA Interleukin 2 receptor subunit alpha 0.8825 70
                                        CD180 CD180 molecule 0.8807 36
                                        IL16 Interleukin 16 0.8807 36
                                        JAML Junction adhesion molecule like 0.8789 70
                                        CD53 CD53 molecule 0.8737 36
                                        CD86 CD86 molecule 0.8737 70
                                        RNA EXPRESSION OVERVIEWi

                                        RNA expression overview shows RNA-data from two different sources: Internally generated Human Protein Atlas (HPA) RNA-seq data and RNA-seq data from the Genotype-Tissue Expression (GTEx) project, as well as the consensus dataset which is based on a combination of both sources. Color-coding is based on tissue groups, each consisting of tissues with functional features in common. To access sample data, click on tissue name or bar.

                                        Consensus dataseti

                                        The consensus dataset consists of normalized expression (nTPM) levels for 55 tissue types, created by combining the HPA and GTEx transcriptomics datasets using the internal normalization pipeline. Color-coding is based on tissue groups, each consisting of tissues with functional features in common. To access sample data, click on tissue name or bar.

                                        Read more about how the datasets were combined into consensus normalized expression levels in Assays & Annotation.

                                        Organ
                                        Expression
                                        Alphabetical
                                        RNA tissue specificity: Tissue enhanced (Lymphoid tissue)
                                        Cerebral cortexCerebellumBasal gangliaHypothalamusMidbrainAmygdalaChoroid plexusHippocampal formationSpinal cordRetinaThyroid glandParathyroid glandAdrenal glandPituitary glandLungSalivary glandEsophagusTongueStomachDuodenumSmall intestineColonRectumLiverGallbladderPancreasKidneyUrinary bladderTestisEpididymisSeminal vesicleProstateVaginaOvaryFallopian tubeEndometriumCervixPlacentaBreastHeart muscleSmooth muscleSkeletal muscleAdipose tissueSkinAppendixSpleenLymph nodeTonsilBone marrowThymus05101520253035nTPM
                                        HPA dataseti

                                        The HPA RNA-seq tissue data is reported as nTPM (normalized protein-coding transcripts per million), corresponding to mean values of the different individual samples from each tissue. Color-coding is based on tissue groups, each consisting of tissues with functional features in common. To access sample data, click on tissue name or bar.

                                        The HPA RNA-seq assay is described in detail in Assays & Annotation.

                                        Organ
                                        Expression
                                        Alphabetical
                                        Cerebral cortexChoroid plexusThyroid glandParathyroid glandAdrenal glandLungSalivary glandEsophagusTongueStomachDuodenumSmall intestineColonRectumLiverGallbladderPancreasKidneyUrinary bladderTestisEpididymisSeminal vesicleProstateOvaryFallopian tubeEndometriumCervixPlacentaBreastHeart muscleSmooth muscleSkeletal muscleAdipose tissueSkinAppendixSpleenLymph nodeTonsilBone marrowThymus05101520253035nTPM
                                        GTEx dataseti

                                        The RNA-seq tissue data generated by the Genotype-Tissue Expression (GTEx) project is reported as nTPM (normalized protein-coding transcripts per million), corresponding to mean values of the different individual samples from each tissue. Color-coding is based on tissue groups, each consisting of tissues with functional features in common. To access sample data, click on tissue name or bar.

                                        The GTEx RNA-seq assay is described in detail in Assays & Annotation.

                                        Organ
                                        Expression
                                        Alphabetical
                                        Cerebral cortexCerebellumBasal gangliaHypothalamusMidbrainAmygdalaHippocampal formationSpinal cordRetinaThyroid glandAdrenal glandPituitary glandLungSalivary glandEsophagusStomachSmall intestineColonLiverPancreasKidneyUrinary bladderTestisProstateVaginaOvaryFallopian tubeEndometriumCervixBreastHeart muscleSkeletal muscleAdipose tissueSkinSpleen024681012nTPM
                                        FANTOM EXPRESSION OVERVIEW
                                        FANTOM5 dataseti

                                        The tissue data for RNA expression obtained through Cap Analysis of Gene Expression (CAGE) generated by the FANTOM5 project are reported as Scaled Tags Per Million. Color-coding is based on tissue groups, each consisting of tissues with functional features in common. To access sample data, click on tissue name or bar.

                                        The CAGE method is described in detail in Assays & Annotation.

                                        Organ
                                        Expression
                                        Alphabetical
                                        Cerebral cortexCerebellumOlfactory bulbPons and medullaCorpus callosumBasal gangliaThalamusMidbrainAmygdalaPonsHippocampal formationSpinal cordRetinaThyroid glandPituitary glandLungSalivary glandEsophagusTongueSmall intestineColonLiverGallbladderPancreasKidneyUrinary bladderDuctus deferensTestisEpididymisSeminal vesicleProstateVaginaOvaryEndometriumCervixPlacentaBreastHeart muscleSmooth muscleSkeletal muscleAdipose tissueAppendixSpleenLymph nodeTonsilThymus010203040506070Scaled Tags Per Million

                                        Contact

                                        • NEWS ARTICLES
                                        • PRESS ROOM

                                        The Project

                                        • INTRODUCTION
                                        • ORGANIZATION
                                        • PUBLICATIONS

                                        The Human Protein Atlas

                                        • DOWNLOADABLE DATA
                                        • LICENCE & CITATION
                                        • HELP & FAQ
                                        The Human Protein Atlas project is funded
                                        by the Knut & Alice Wallenberg Foundation.


                                        contact@proteinatlas.org